

Reacher Stephen
How to Measure Influencer Marketing ROI: Real Benchmarks, Formulas, and Attribution
Learn how to calculate true influencer marketing ROI. Discover realistic industry benchmarks, attribution methods, cost formulas, and creator strategies that convert.

influencer marketing roi
Influencer marketing ROI becomes meaningful when revenue is measured against the full cost of producing it. A post can generate reach and still lose money after creator fees, gifted inventory, shipping, licensing, staff time, software, and paid amplification are included. Connect attributable revenue to a complete investment record, then separate evidence of demand from attention metrics.
Key Takeaways
- You can only call influencer marketing ROI meaningful when revenue is directly tied to the full campaign cost including creator fees, inventory, shipping, staff time, and paid promotion.
- High reach and engagement numbers mean nothing if the total investment exceeds the attributable revenue from that content.
- Build a complete cost ledger for every campaign so you can separate real demand signals from attention metrics that don't drive profit.
- Measure profitability by comparing the full investment to revenue that can be uniquely linked back to each influencer post.
This framework gives finance and marketing teams a shared method for evaluating creator programs. It replaces surface-level engagement with contribution margin, customer acquisition cost, tracked sales, content value, and repeatable operating data.
The Real ROI of Influencer Marketing: Beyond Vanity Metrics
Calculate influencer marketing ROI by subtracting the fully loaded campaign cost from attributable profit, then dividing that result by the fully loaded cost. Impressions, likes, and follower count describe distribution, not financial outcomes. Revenue, gross margin, new customers, assisted conversions, and content licensing value show whether the program supports profitable growth.
Why Traditional ROI Formulas Fall Short
The common formula, (revenue minus creator spend) divided by creator spend, excludes expenses that determine whether a campaign worked. A $10,000 creator fee may require additional allocation for product samples, fulfillment, briefing, contract review, affiliate administration, analytics, and content rights. If those costs remain outside the calculation, the reported return is overstated.
Engagement rate creates a similar problem. Likes and comments can indicate attention, but they do not establish purchase intent or margin. A broad video may attract viewers outside the target market, while a smaller post can produce qualified traffic, product page views, add-to-cart events, and completed orders. Treat each metric according to its role in the customer journey.
The Practitioner's Dilemma: Proving Value to Finance
Finance teams need a defensible connection between spend and business performance. Creator programs may include delayed purchases, multiple touchpoints, discount-code leakage, view-through behavior, and sales on another platform. Measurement requires a consistent reporting period, clear conversion rules, and a record of cash expenses and operational labor.
Present the program as an investment portfolio rather than isolated posts. Report spend by creator, campaign, product, audience, and channel. Pair attributed sales with gross profit, customer acquisition cost, average order value, refund rate, and new-customer share. Influencer Marketing Hub reports average returns ranging from $5.20 to $5.78 for each dollar spent across industries, while top ecommerce performers can reach 10x. These benchmarks are directional, not a substitute for your own unit economics.
Calculating Your True Influencer Marketing Investment: The Fully Loaded Cost Formula
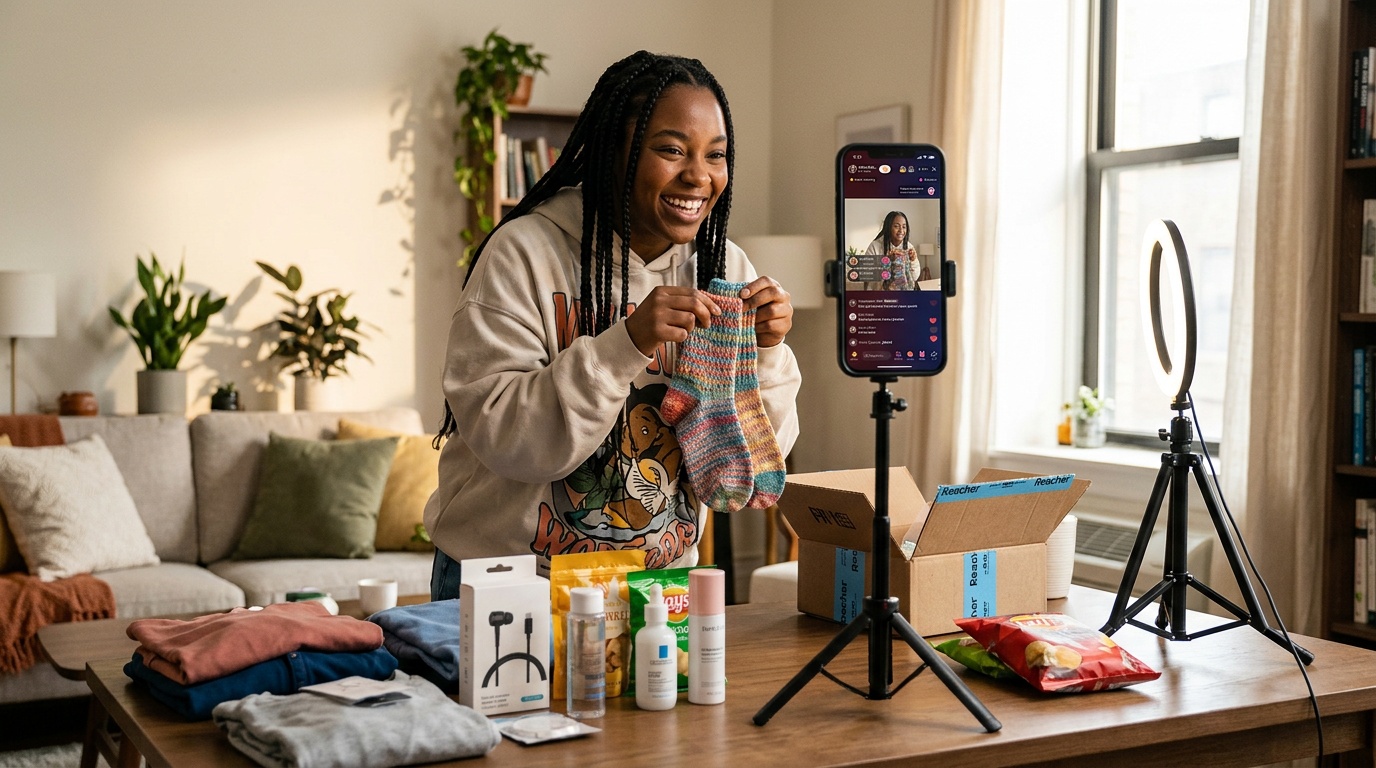
Record committed fees, actual payments, inventory movement, labor hours, platform charges, and usage rights in one campaign ledger. Assign a dollar value to internal work using the employee’s loaded hourly rate, which includes wages and applicable benefits. This produces a cost figure that reflects the resources the program consumed.
Direct Campaign Costs: Creator Fees & Content Licensing
Include flat fees, affiliate commissions, performance bonuses, agency charges, payment processing, exclusivity premiums, whitelisting, Spark Ads permissions, and the duration and placement of content rights. A short organic posting license is not equivalent to six months of paid media usage. Contracts should identify platforms, geographic scope, editing rights, renewal fees, and expiration date.
Indirect Costs: Product Gifting, Shipping, and Logistics
Gifted product carries more than its retail price. Use cost of goods sold rather than the listed selling price, then add packaging, pick-and-pack labor, postage, insurance, customs charges where applicable, replacement shipments, and returned inventory. Track samples that never become published content. Those units still belong in the campaign investment, even if the creator declines, misses a deadline, or produces content that cannot be approved.
Operational Overhead: Time, Tools, and Management Labor
Count hours spent sourcing creators, reviewing audience quality, negotiating terms, preparing briefs, approving scripts, sending products, answering questions, generating tracking links, monitoring comments, reconciling commissions, and building reports. Add creator relationship software, affiliate platform fees, social listening subscriptions, URL tracking, dashboard costs, and creative production support. A centralized influencer marketing performance dashboard can help keep these operating metrics visible alongside campaign economics.
The Formula in Practice: A Step-by-Step Breakdown
Establish committed costs, verify actual costs, calculate attributable contribution profit, and compare profit with the complete investment. Apply consistent treatment to discounts, refunds, shipping subsidies, and payment fees. If a sale cannot be tied to a defined source, place it in an assisted or unassigned category rather than adding it to direct revenue.
Fully loaded investment = creator fees + commissions and bonuses + licensing and usage rights + gifted product cost + shipping and fulfillment + agency and platform fees + paid amplification + internal labor + reporting and technology costs.
True return = (attributable contribution profit minus fully loaded investment) ÷ fully loaded investment.
| Cost area | Record in the ledger | Why it changes the decision |
|---|---|---|
| Creator compensation | Flat fee, commission, bonus, exclusivity | Shows the cash requirement for talent and performance. |
| Content rights | Organic license, paid usage, renewal period | Separates publishing cost from media and creative asset value. |
| Product operations | COGS, samples, packing, shipping, replacements | Reveals the margin impact of gifting and fulfillment. |
| Team capacity | Hours multiplied by loaded hourly rate | Shows the labor required to operate the program at scale. |
| Measurement | Tracking, software, reconciliation, reporting | Prevents data collection and attribution work from disappearing. |
Compare planned and actual figures after every campaign. Flag extra revisions, delayed fulfillment, higher commission rates, or added ad spend. This audit creates a baseline for negotiations and budget decisions and gives the marketing influencer program a financial structure that can withstand scrutiny.
Measuring Genuine Impact: Shifting from Engagement to Purchase Intent
Report qualified reach, profile visits, product views, link clicks, add-to-cart events, purchases, contribution margin, and repeat orders as separate stages. This shows demand quality and prevents a high-engagement post from receiving credit for sales it did not influence.
Why Impressions and Likes Do Not Drive Revenue
Reach is useful when it connects with the right audience and creates a measurable next action. A video may attract viewers outside your service area, customers without purchase authority, or people interested in entertainment rather than the product. Likes may confirm that content was enjoyable, yet they rarely reveal whether the viewer had a need or enough confidence to buy. Use engagement as a creative-quality signal, not a financial outcome.
Awareness metrics assess distribution, consideration metrics reveal shopping behavior, and conversion metrics support budget decisions. Contribution profit, customer acquisition cost, conversion rate, average order value, refund rate, and new-customer share belong in the executive report. Engagement rate can remain in creative review.
Identifying Purchase Intent: Analyzing Comments and Questions
Classify comments by intent. High-intent examples include questions about price, sizing, shipping time, availability, ingredients, product compatibility, warranty coverage, and where to purchase. Mid-intent comments ask for demonstrations, comparisons, or selection advice. Low-intent reactions express amusement, tag friends, or praise the creator without mentioning a need.
For each post, record purchase questions, product-page requests, saved-video signals, direct messages, and creator replies that move viewers toward a tracked destination. Compare those signals with click-through rate and checkout data. Comment buying intent is not a replacement for transaction data, but it can indicate demand while sales volume is developing.
Platform-Specific Benchmarks: What to Expect on TikTok, Instagram, and YouTube
Benchmarks guide investigation rather than guarantee results. Audience composition, product category, creative format, offer strength, tracking quality, and account maturity all affect performance. TikTok often supports rapid discovery and direct product consideration, Instagram can support relationship-led evaluation through Stories, Reels, and direct messages, while YouTube often provides longer demonstrations and information depth. Judge each channel against its role in the buying journey.
| Platform | Useful leading signals | Revenue evidence to prioritize | Measurement focus |
|---|---|---|---|
| TikTok | Product questions, profile visits, saves, link taps | Tracked orders, affiliate sales, product-page sessions | Creator discovery, short-form conversion, commerce behavior |
| Story replies, shares, direct messages, profile actions | Code redemptions, tagged visits, assisted conversions | Relationship development and repeat exposure | |
| YouTube | Watch time, description clicks, returning viewers | Tracked purchases, branded search lift, qualified traffic | Education, product demonstration, delayed consideration |
Archive reports that 50% of marketers identify TikTok as the strongest platform for direct ROI, and 78% of TikTok users purchase after discovering a product through creators. Sprout Social reports that 86% of consumers complete at least one creator-driven purchase each year. Use these findings as planning context, then validate performance through your own links, codes, storefront analytics, and margin data.
The Power of Comment Buying Intent vs. Engagement Rate
Engagement rate combines behaviors with different commercial meaning. A share to a qualified prospect, a product question, and a casual like should not receive equal weight. Build a purchase-intent index that counts meaningful actions by category, then compare it with qualified sessions, add-to-cart activity, and completed orders. Keep the index directional unless it has been validated against sufficient transaction history.
Closing the Attribution Gap: Social Commerce and Multi-Month Partnerships
Last-click reporting can undervalue content that introduces a product, answers objections, or brings a shopper back days later. Separate direct sales, assisted conversions, new-customer acquisition, and repeat purchases so leadership can see immediate return and longer-term demand.
The Limitations of Traditional Attribution Models
A customer may watch a creator video, search for the product later, visit through a retargeting ad, and purchase through a branded search result. Assigning all credit to the last interaction can cause teams to cut the content that created initial demand. Use a primary attribution model for budget decisions and maintain an assisted-conversion view for strategic analysis. Document the lookback window, eligible touchpoints, and coupon-code treatment before the campaign begins.
Leveraging TikTok Shop's Native Commerce Features for Direct Tracking
TikTok Shop connects creator content and transaction data more closely than campaigns that send shoppers across multiple sites. Assign each creator a dedicated affiliate relationship, product link, commission structure, and content identifier. Reconcile attributed orders with product revenue, cancellations, refunds, discounts, and fulfillment costs. Archive reports that 50% of marketers identify TikTok as the strongest platform for direct return, and 78% of TikTok users purchase after creator discovery.
Why 90-Day Creator Partnerships Outperform One-Off Campaigns
A 90-day partnership gives the creator time to understand the product, test hooks, answer audience questions, and improve calls to action. The brand gains more content and sales data, while the audience receives repeated exposure. A quarterly structure also supports forecasting, negotiated usage rights, and planned creative testing. Track performance by week and asset, then renew based on contribution margin, qualified traffic, customer quality, and content efficiency.
Operational Blueprint: Structuring Long-Term Creator Collaborations
Build the partnership around a written operating plan:
- Set the commercial brief: define the product margin, target customer, offer, success metrics, approved claims, and tracking method.
- Assign a testing calendar: schedule education, demonstration, comparison, objection handling, and seasonal content across the 90-day period.
- Give creators usable feedback: review audience response, product questions, watch behavior, clicks, and orders without dictating every creative choice.
- Review economics monthly: include commissions, refunds, fulfillment, paid distribution, and internal labor in the performance record.
- Set renewal thresholds: continue, revise, or pause the relationship according to profitable sales and reusable content value.
Repurposing High-Performing Creator Assets into Paid Media
Organic performance can identify creative worth testing in paid distribution, but permission and licensing must be secured first. Select assets with strong product questions, qualified clicks, add-to-cart activity, or profitable orders. Test hooks, captions, offers, and landing destinations. Record paid spend separately from creator fees, then evaluate incremental purchases, cost per acquisition, return on ad spend, and contribution margin. Spark Ads can extend a creator post while preserving its social context, provided the agreement covers paid usage, duration, editing, and audience targeting.
Strategic FAQ: Executive-Level Answers to Influencer ROI Challenges

How do we justify creator spending when attribution is not perfect?
Show direct sales, assisted conversions, contribution margin, new-customer share, and content reuse in separate lines. State attribution rules openly and compare results with a consistent baseline. Finance can approve uncertainty when assumptions, costs, and decision thresholds are visible.
What is the average return for influencer marketing in the current year?
Research from Influencer Marketing Hub places broad average returns between $5.20 and $5.78 per dollar spent, while top ecommerce programs can reach 10x. These are directional benchmarks. Product margin, refund rate, audience quality, and fully loaded costs determine the result that matters.
How can we scale creator programs without overwhelming our team?
Standardize briefs, contracts, tracking IDs, approval stages, reporting templates, and renewal rules. Use batch outreach automation and a single performance dashboard so staff spend time on creator strategy rather than spreadsheet reconciliation.
When should we invest in AI for creator management?
Adopt AI when manual sourcing, screening, follow-up, content review, or reporting limits campaign volume or slows decisions. Reacher can help organize AI-powered creator discovery and performance workflows, while your team retains control over brand fit, commercial terms, and final approvals.
Frequently Asked Questions
What is the average ROI for influencer marketing?
Influencer marketing ROI averages about $5.20 to $5.78 in return for every dollar spent across industries, based on reported benchmarks. Top ecommerce campaigns may reach 10x, but results depend on contribution margin, attribution, customer quality, repeat purchases, and the full campaign cost, including fees, products, labor, licensing, and paid promotion.
How many influencers make over $100,000?
Influencers earning over $100,000 represent a minority of creators, and no single figure applies across platforms or income sources. Influencer income varies by audience quality, content rights, sponsorship fees, affiliate sales, platform payouts, and product revenue, so brands should evaluate creator performance through profitable sales rather than follower count alone.
What is the 5-3-2 rule on Instagram marketing?
The 5-3-2 rule on Instagram marketing suggests sharing five pieces of relevant content, three pieces from trusted sources, and two personal or brand-focused updates within a 10-post cycle. The guideline can support a balanced content mix, but influencer marketing ROI still requires tracking attributable sales, contribution profit, customer acquisition cost, and repeat purchases.
What type of marketing has the highest ROI?
The marketing channel with the highest ROI is the one that produces the strongest contribution profit after its full cost is counted. Influencer marketing, email, search, referrals, and paid media can all lead depending on the offer and audience, so compare attributable profit, acquisition cost, conversion rate, refunds, and repeat revenue using consistent rules.
What business has the fastest ROI?
Businesses with short purchase cycles, strong margins, low fulfillment costs, and clear conversion tracking often produce the fastest ROI. Ecommerce products with demonstrated demand can recover marketing spend quickly, while longer sales cycles require assisted-conversion reporting, cohort analysis, and a defined measurement period before judging influencer marketing performance.
How do you calculate influencer marketing ROI accurately?
Influencer marketing ROI equals attributable contribution profit minus fully loaded campaign cost, divided by fully loaded campaign cost. Include creator fees, commissions, gifted product at cost, shipping, labor, software, licensing, paid amplification, discounts, refunds, and fulfillment, then separate directly tracked sales from assisted or unassigned demand.